


By Vivek Shitole
Many organizations are good at deploying information security controls but are primarily reactive, meaning they are designed to mitigate the incident after it happened but not to avoid it. Understandably, deploying proactive security controls for all types of potential InfoSec incidents is not feasible. This is where the Six Sigma methodology’s DMAIC (Design, Measure, Analyze, Improve, Control) approach can be handy. In this article, I have tried to explain how to use the DMAIC approach from the Six Sigma methodology using a real-time case study, where a proactive reduction in information security tickets/incidents using the Six Sigma project methodology is demonstrated below.
Situation: In my previous company, one of the vital projects (12 resources onsite & 40 resources offshore) was continuously reporting defects beyond the agreed-upon level (with the client). After a certain period, the client decided to abort this contract.
Task: To reduce the defects, show improvement in service provided & save that vital contract.
Actions: The director of my project management team chose me to handle this situation. I, along with my team, carefully studied the client escalation report, defined the scope of the problem, and measured the required performance indicators. After that, we analyzed the data, brainstormed possible solutions, and selected the best optimal solution. Then, with the help of project people, we implemented the solution and tracked the improvement.
Result: We achieved a defect reduction of more than 60 %! The client was satisfied with the results and decided to continue our services. Thus, the contract was saved and extended by two more years.
Note: This article expects readers to have a basic knowledge of Six Sigma and statistics. It is focused on using these statistical tools to reduce InfoSec incidents. This article may not cover details of statistical terminology, but the reference links should be helpful.
DESIGN PHASE:
Six Sigma Team Project Charter
Title: Infrastructure stabilization through InfoSec tickets inflow reduction (in other words, Application and Infrastructure stabilization by preventing InfoSec-related service interruptions)
Business Case: Business cases typically highlight compelling reasons for doing the project, in other words, the advantages of doing the Project versus the disadvantages of Not Doing the Project.
This project’s primary focus was reducing InfoSec ticket call volume (service interruptions or defects) on the applications and infrastructure supported by the team. Via client satisfaction surveys and various meetings, the client had strongly expressed the need to work on more proactive service optimization initiatives.
Projected advantages of the project
- Application and Infrastructure stability
- Resilient Applications and Infrastructure from InfoSec point of view
- Better user experience
- Efforts saving for the “InfoSec Tickets prevented”
- Increase in resource availability for doing additional scope of work/ other value activities
- Increase in customer satisfaction
- Additional orders from the same client
Project Strategy
- Total seven applications in a project. Backup, Microsoft, SAP, DBA, ERP, Monitoring, AIX – Design phase
- InfoSec tickets data to be drilled down for identification of potential failure modes – Measure phase
- Each of the tickets to been tagged to causes categories/failure modes – Measure phase
- Occurrence of each cause category/failure mode to be calculated using pivot tables – Measure phase
- The top few Failure modes of each tower are further prioritized using FMEA analysis – Analyze phase
- Action plans to be identified for those failure modes which have higher RPN – Analyze phase
- Cost-benefit analysis to be done based on selection of action proposals – Analyze phase
- Selected action plans to be piloted on only one application first and check results to validate success – Improve phase
- Once the actions are found to be effective on one application, they can be rolled out to other applications and infrastructure – Improve phase
- Identify control limits using data from improved weeks and monitor performance over at least 4-6 weeks – Control phase
MEASURE PHASE:
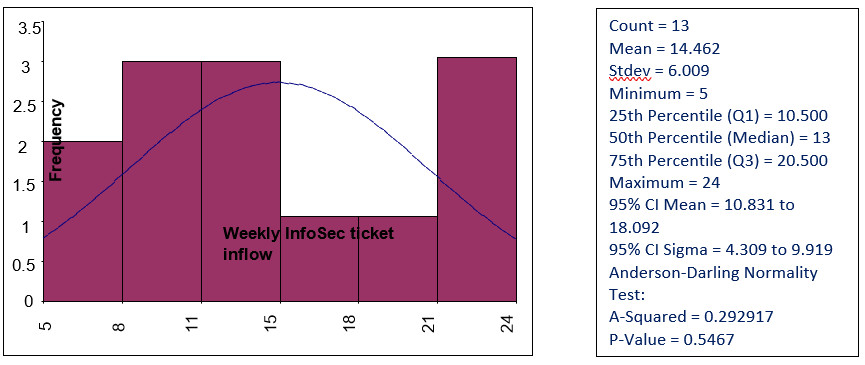
Inflow of InfoSec tickets data – Before
We plotted a histogram chart based on the raw data to represent the frequencies and other statistical parameters of the As-Is situation.
Fig 1:
The measurement phase primarily included measurements and data collection around InfoSec incidents and tickets reported during the given duration. We plotted the following classification chart from the raw data received to convert raw data into measurable information. The resulting InfoSec Incidents classification chart is shown below.
Fig 2:
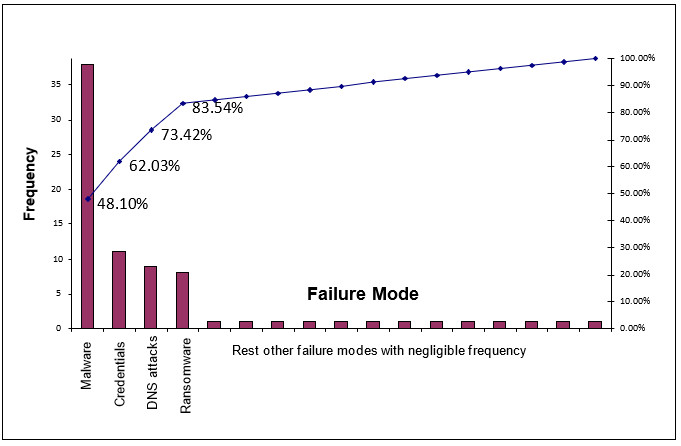
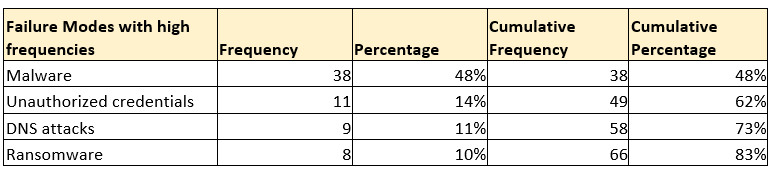
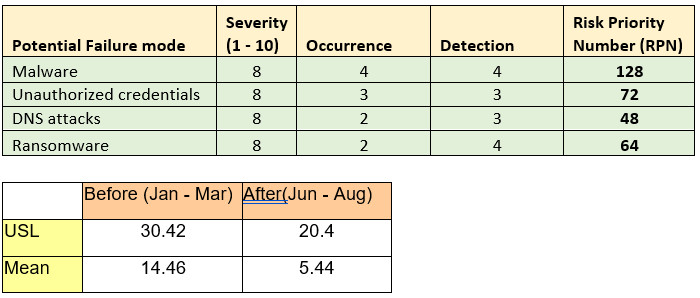
Then, we used the Incident Failure Mode Effect Analysis (FMEA) technique to separate prominent failure modes using the 80-20 rule. In this case, the failure modes are nothing but the root causes behind various InfoSec tickets. We analyzed the top four causes (contributing to more than 80% of total failure modes) and prepared action plans for them.
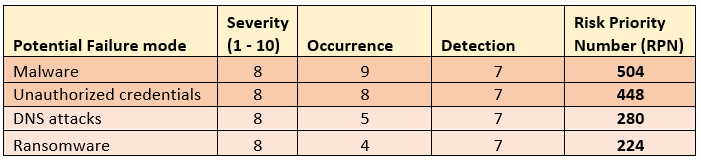
The following steps were to determine the Risk Priority Number for each prominent failure mode.
ANALYSE PHASE:
Recommended action items and cost-benefit analysis:
Fig 3:
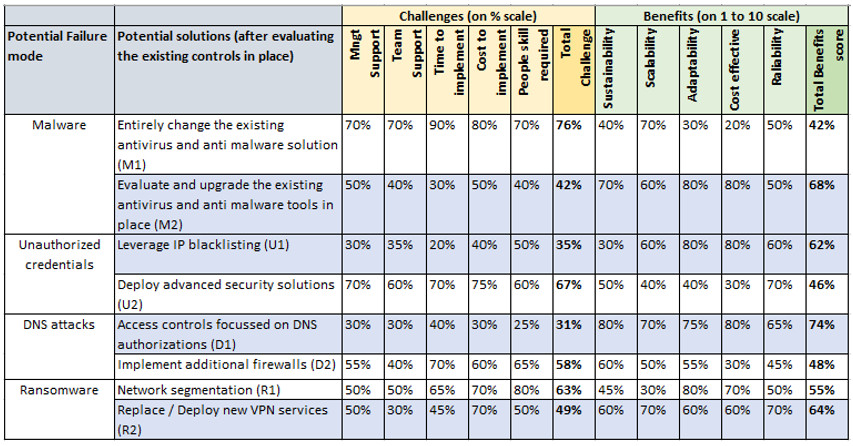
Fig 4:
The two figures above highlight the four action plans selected for implementation based on the detailed cost-benefit analysis.
IMPROVE PHASE:
Below are details on the improvements achieved after different teams responsible for the selected improvement actions implemented those actions.
Fig 5:
2 sample T-test (InfoSec Ticket count Jan-Mar VS Jun-Aug)
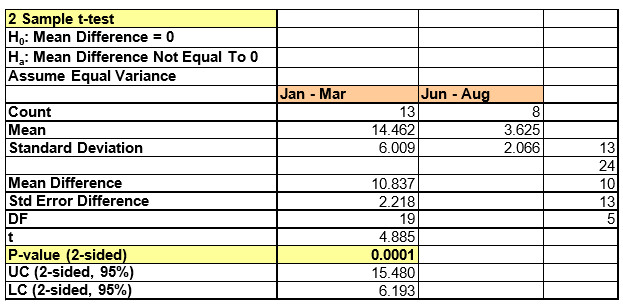
- Before stage: Jan – Mar InfoSec ticket data has been considered.
- After Stage: Jun – Aug InfoSec ticket data has been considered.
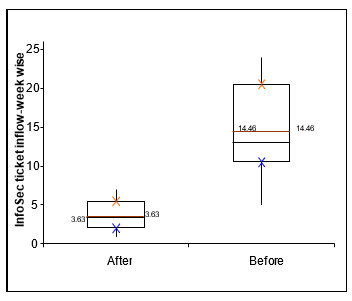
- Box plot shows a significant shift in mean and shrink in variation between before and after stages.
- The 2-sample T-test result indicates that the P value is significantly different & <0.05, which indicates the Null Hypothesis is true and implies a difference in Mean before & after stages.
Fig 6: Box Plot Representation of the data above.
FMEA On high call volume – After
Control charts of InfoSec tickets: Before & After
- Before Stage: Jan – Mar, the weekly InfoSec tickets inflow has been considered
- After Stage: Jun – Aug, weekly InfoSec tickets inflow ticket has been considered
- A significant shift in UCL & Mean is shown in the table below & Highlighted in the control chart.
CONTROL PHASE:
Control is about finishing the final 10 percent. If the changes are not implemented correctly or accurately measured, then the entire DMAIC process has failed. The DMAIC process should end with delivering a process improvement that returns savings to the business.
Conclusion:
Tangible Benefits of Six Sigma implementation:
– Reduction in InfoSec-related ticket volume.
Intangible Benefits:
– Infrastructure stability
– Increase in resource availability for doing additional scope of work / other value activities
– Increase customer satisfaction for less incident tickets related to InfoSec
About Author
Vivek Shitole is an experienced professional with 18 years in Information Security and Privacy, Risk Management consulting, and performance improvement. He has led teams in data-driven risk management engagements and held leadership roles in Oracle’s Business Assessment & Audit group. With an MBA in Operations and IT and an engineering degree, Vivek is also a dedicated athlete, having completed a full-distance Ironman at IMTX 2023 and various marathons.


